- Tue 26 May 2020
- behavior
- #pivot table, #happiness, #behavioral economics
"Happiness can change, and does change, according to the quality of the society in which people live." -John F. Helliwell
Project Purpose
This project had a two-fold purpose for me. The World Happiness Data Set seemed to be the best data to apply both data analysis skills and behavioral economics.
In 2017, Richard Thaler’s win of the Nobel Prize in economics marked the third time the prize has been tied to the growing field of behavioral economics. In addition to Nobel Prizes, this new discipline has spawned bestselling books, new agencies within governments and even new majors within universities. What it hasn’t led to is new national statistics.
The most established national statistics – gross domestic product, household income and unemployment – focus on rational behavior: what people spend, how much they make, and whether they have a job. What they don’t capture is how people feel. These "feelings" are important because economic agents are simply humans and economic models should account for these human elements when making decisions. In this way, wellbeing and happiness are critical metrics for a nation's social and economic development.
For another perspective, here is a short 2 minute video on why Gallup, a survey company, measures global happiness:
from IPython.display import YouTubeVideo
YouTubeVideo('7QJBqak4GpI')
About The Data
Taken from: https://worldhappiness.report/ed/2020/
Each country's "Happiness Score" is calculated by summing the seven other variables in the table:
- Economy: GDP per Capita
- Family: Social Support
- Health: Life Expectancy
- Freedom: Freedom to Make Life Choices
- Trust: perceived corruption
- Generosity: perceptions of generosity
- Dystopia: Each country is compared to "Dystopia" which is a hypothetical nation with the lowest value for each of the 6 factors. The residual error between "Dystopia" and the country is used as a benchmark for regression
Questions Explored
- Which are the happiest and least happy countries and regions in the world?
- Is happiness affected by region?
- Did the happiness score change significantly from 2015 to 2017?
- Is the World Happiness Report an accurate measure true happiness?*
import numpy as np
import pandas as pd
import matplotlib.pyplot as plt
import seaborn as sns
sns.set_style('darkgrid')
import hvplot.pandas
df = pd.read_csv('happiness.csv', index_col=0)
df.head()
#sort by year ascending and happiness score descending
df.sort_values(['Year','Happiness Score'], ascending=[True, False], inplace=True)
df.head()
#size of data
print('rows: {}\ncolumns: {}'.format(df.shape[0],df.shape[1]))
#count of missing values for each column
df.isnull().sum().sort_values(ascending=False)
#all rows with missing values
df[df.isnull().any(axis=1)]
#drop rows with missing values
df.dropna(inplace=True)
print('2015 entries: ',str(df[df['Year']==2015].shape[0]))
print('2016 entries: ',str(df[df['Year']==2016].shape[0]))
print('2017 entries: ',str(df[df['Year']==2017].shape[0]))
plt.figure(figsize=(12,10))
sns.heatmap(df.drop(['Happiness Rank','Dystopia Residual'],axis=1)\
            .corr(),square=True,annot=True,cmap='coolwarm')
It seems that GDP Per Capita, Life Expectancy, and Family are strongly correlated with the Happiness Score. This makes sense because according to the World Happiness Report, the richer the country, the higher people typically rate their lives. Having a higher life expectancy means you can worry less about survival and having a stronger sense of family gives someone a greater social and financial safety net.
A major problem to realize in predicting happiness is that all 3 of these factors are strongly correlated with each other. This is especially true with life expectancy and GDP per capita as countries with more money will be better able to provide proper healthcare.
Happiness by Year
pivot1 = pd.pivot_table(df,
                        index='Year',
                        values='Happiness Score')
pivot1
Global happiness has not seemed to have changed much in the 3 years given.
Happiness by Region
pivot2 = pd.pivot_table(df,
                        index='Region',
                        values='Happiness Score')

pivot2.sort_values(by='Happiness Score',ascending=False)
Australia and New Zealand are the top regions for happiness with Sub-Saharan Africa at the bottom.
Happiness by Year and Region
pivot3 = pd.pivot_table(df,
                        index='Region',
                        columns='Year',
                        values='Happiness Score')

pivot3.plot(kind='bar',figsize=(16,6))
plt.legend(bbox_to_anchor=(0.9, 1.0))
Here you can see that shifts in happiness occur differently in different regions. For example, Central and Eastern Europe has risen the over the past 3 years while North America has dropped over 3 years.
Adding More Stats For Each Region
pivot4 = pd.pivot_table(df,
                        index='Region',
                        values='Happiness Score',
                        aggfunc=[np.mean, np.median, np.std, min, max])
pivot4
The standard deviation helps to quantify the variability of happiness within regions. The Middle East and Northern Africa region contains the highest deviation and a huge range of happiness scoeres from near the bottom (Syria, 3.006) to near the top (Israel, 7.278).
Removing Outliers From Each Region
def remove_outliers(x):
    mid_quartile = x.quantile([.25,.75])
    return np.mean(mid_quartile)

pivot5 = pd.pivot_table(df,
                        index='Region',
                        values='Happiness Score',
                        aggfunc=[np.mean,remove_outliers])

pivot5.plot(kind='bar',figsize=(16,6))
plt.legend(bbox_to_anchor=(0.9, 1.0))
After removing outlier countries, most regions saw a slight increase in their happiness score with the exception of Eastern Asia and Australia and New Zealand. Overall, most regions stay fairly similar in happiness and don't change that much regardless if outlier countries are removed or not.
Binning Countries By Happiness Score
score = pd.qcut(x=df['Happiness Score'],
                q=3,
                labels=['bottom 1/3','middle 1/3','top 1/3'])

pivot6 = pd.pivot_table(df,
                        index=['Region',score],
                        values='Happiness Score',
                        aggfunc='count',
                        fill_value=0,
                        dropna=False)
pivot6
This table illustrates the amount of times their countries have been in the bottom, middle, or top 1/3 of the world's happiness. You can see the huge disparity between regions when binned. For example, Western Europe has 0 countries in the bottom 1/3 of happiness, and Sub-Saharan Africa has 0 countries in the top 1/3, with the high majority at the bottom.
Searching For Any Connections
#Add quantile to split countries into 4 levels of happiness
df['quantile'] = pd.qcut(x=df['Happiness Score'],
               q=4,
               labels=['low','low-mid','top-mid','top'])
df.head()
from sklearn import preprocessing
min_max_scaler = preprocessing.MinMaxScaler()

#columns to graph
cols = df.columns[3:10].tolist()

#Only use 2017 data to make graph less busy
temp_df = df[df['Year']==2017].reset_index()

#Transform all data to a scale from 0 to 1 to look for patterns
temp_df.loc[:,cols] = min_max_scaler.fit_transform(temp_df[cols])
hvplot.parallel_coordinates(temp_df, 'quantile', cols=cols, alpha=.3, tools=['hover', 'tap'], width=800, height=500)
Is there a pattern to what the most happy countries look like? It appears that they are highest in GDP per capita, family, and life expectancy as found earlier. Countries tend to be split fairly well by GDP per capita, family, life expectancy, and freedom while perceived government corruption and generosity look like a free-for-all. The only exception is that top countries tend to have the best government corruption ratings, which makes sense because the top is flooded with Scandinavian countries who tend to be very transparent with their government actions.
My Concerns
Chosen Metrics
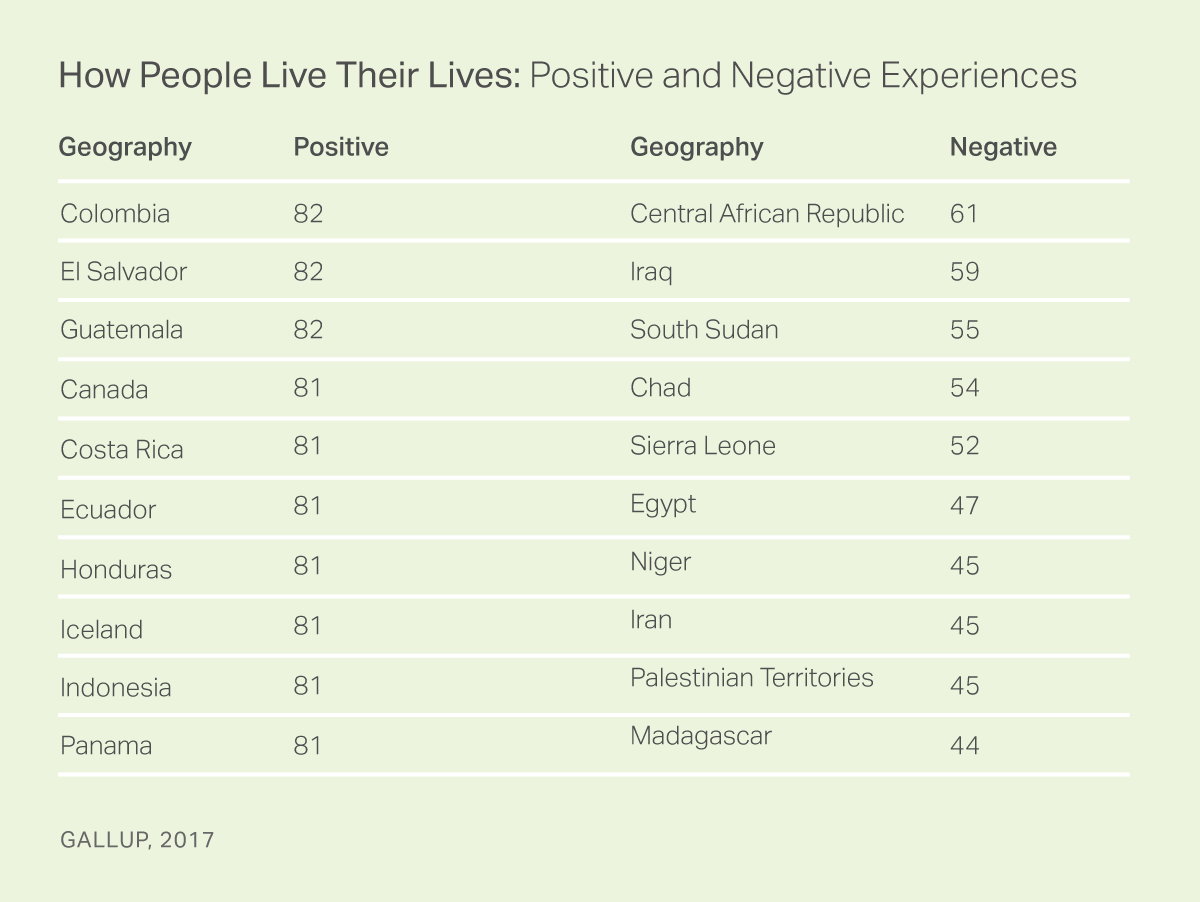
My main concerns for the World Happiness Report is the high focus on GDP per capita and the strongly correlated features such as family and life expectancy. Some argue that questioning on overall life status leads humans to overweigh income concerns, rather than happiness. This concern can be validated by a 2017 Gallup poll which rated countries based on the positive and negative experiences of their lives and found the list dominated by Latin America. El Salvador was rated as 2nd on this list while the World Happiness Report found El Salvador ranked at 45th.

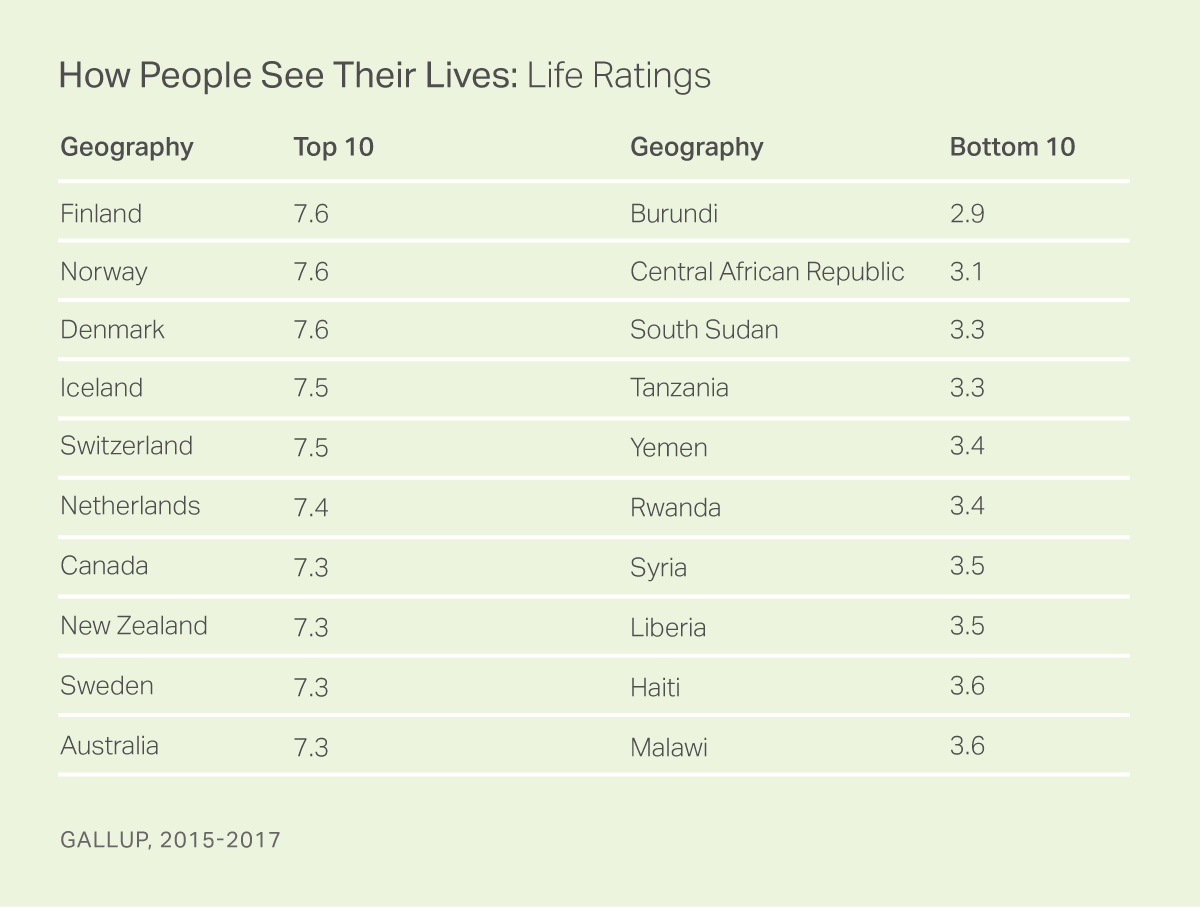
In comparison, this same survey looked at how people perceived their lives (similar to the World Happiness Report) and found a fairly similar ranking. It seems people tend to over-value their income when it is brought up as a factor for happiness.

Also, according to the Wiki article on the World Happiness Report, some point out that the ranking results are counterintuitive when it come to some dimensions. For instance, "if rate of suicide is used as a metric for measuring unhappiness, (the opposite of happiness), then some of the countries which are ranked among the top 20 happiest countries in the world will also feature among the top 20 with the highest suicide rates in the world."
Philosophical
Measuring happiness in a group of people can be misleading because happiness is an individual event. It is dependent on the individuals perception of their life, which is independent of the environment they are placed in. For example, in the book Man's Search for Meaning by Viktor Frankl, while Dr. Frankl was imprisoned in a Nazi concentration camp, he found the ones that faired best had a strong reason, a "why", that kept them going. Everyone was in the same situation, but their well-being was deeply affected by their thoughts.
On the other side, the metrics are useful for finding overall trends that can be improved in a country such as healthcare and general well-being, but this is far from the complete formula for individual happiness. A happy or unhappy country is just an average of happy and unhappy individuals.
So, Does the World Happiness Report Measure True Happiness?
The answer depends on how you define happiness. If you think happiness is how people see their lives -- then Norwegians are the happiest people in the world. If you think happiness is defined by how people live their lives through experiences such as smiling and laughing, enjoyment and feeling treated with respect each day -- then the happiest people in the world are Latin Americans.
How people reflect on their lives is very different from how people live their lives. For example, if you interview two women -- one with a child and one without a child -- which one has more stress? On average, it's the woman with the child. But if you asked them to rate their overall lives, whose rating is higher? It's also the woman with the child. So, the woman with more stress also rates her life higher.
So, How Should We Measure Happiness?
Global happiness studies often involve two measures -- how people see their lives and how they live their lives. The World Happiness Report only uses the former.
We can measure how others live their lives using indexes for positive and negative experiences. According to Gallup, there are 5 main positive and negative experiences:
Positive experiences
- feeling well-rested
- laughing and smiling
- enjoyment
- feeling respected
- learning or doing something interesting
Negative experiences
- stress
- sadness
- physical pain
- worry
- anger
Both of these concepts are rooted in behavioral economics, and both are necessary for providing a more clear picture of how people's lives are going. Are people satisfied with their lives? Do they have healthy levels of enjoyment and stress? Both questions are important, and this is exactly why we need to measure both life satisfaction and emotions.
